# Plotting plug
**URL:** https://community.silverbullet.md/t/plotting-plug/3417
**Category:** Ideas
**Created:** [October 18, 2025, 8:17pm UTC](https://community.silverbullet.md/t/plotting-plug/3417 "2025-10-18T20:17:37Z")
**Posts on this page:** 12
**Page:** 1
### Author:  [@thick.cliff](https://community.silverbullet.md/u/thick.cliff)
#### Post date: [October 18, 2025, 8:17pm UTC](https://community.silverbullet.md/t/plotting-plug/3417/1 "2025-10-18T20:17:37Z")
Plug to plot things
```auto
page1
---
date: 2025-01-01
squirrels: 2
cats: 4
---
page1
---
date: 2025-01-03
squirrels: 4
cats: 4
---
```
Replicate a subset of the functionality from some plotting library. Perhaps the api could look something like
````auto
```plotplug
type: scatter
data: query(from tags.page select {x: date, y: [squirrels, cats]})
````
---
### Author:  [@MrMugame](https://community.silverbullet.md/u/MrMugame)
#### Post date: [October 18, 2025, 11:23pm UTC](https://community.silverbullet.md/t/plotting-plug/3417/2 "2025-10-18T23:23:03Z")
This could be achieved using [Chartist](https://gionkunz.github.io/chartist-js/index.html) and some SpaceLua.
---
### Author:  [@LelouchHe](https://community.silverbullet.md/u/LelouchHe)
#### Post date: [November 17, 2025, 5:00am UTC](https://community.silverbullet.md/t/plotting-plug/3417/3 "2025-11-17T05:00:59Z")
I have tried [Chart.js](https://www.chartjs.org/) with below space-lua:
```auto
local chartjs = js.import("https://cdn.jsdelivr.net/npm/chart.js@4.5.1/auto/+esm")
function chart(config)
local canvas = dom.canvas {
id = "chart-" .. os.time() .. "-" .. math.random()
}
local rendered = false
local function timeout()
local target = js.window.document.getElementById(canvas.id)
if not target then
js.window.setTimeout(timeout, 100)
return
end
if rendered then
return
end
rendered = true
js.new(chartjs.Chart, target, config)
end
js.window.setTimeout(timeout, 100)
return widget.html(canvas)
end
```
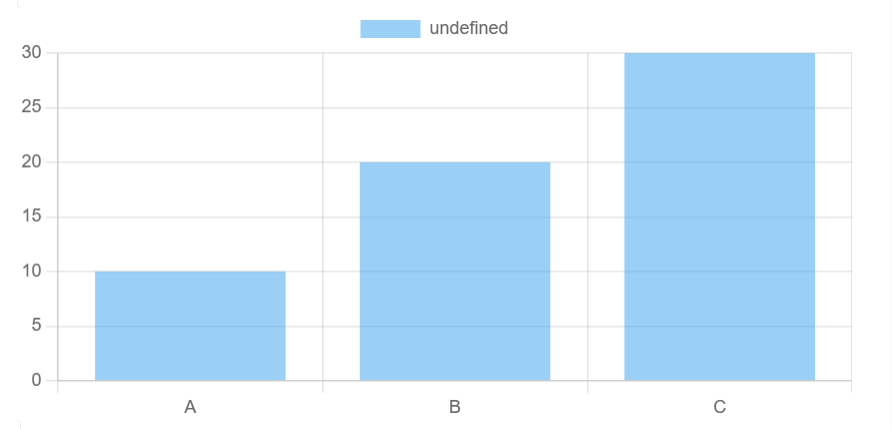
And it should be used as inline expression, with similar config of its JS version:
```auto
${chart {
type = "bar",
data = {
labels = {"A", "B", "C"},
datasets = {{data = {10, 20, 30}}}
}
}}
```
It then turns into something like:
But it has some limits:
1. current js interop doesn’t import static member of an exported class. one of the static member is `Chart.register`, which is used to enable plugins. so plugins can’t be used
2. Chart.js uses canvas to render chart, and it loses all drawn content once it’s passed to main frame. so I have to use a `timeout` to monitor when it’s mounted. it’s better to have a native “mount” event for widget
---
### Author:  [@kaiser2k20](https://community.silverbullet.md/u/kaiser2k20)
#### Post date: [November 18, 2025, 7:03pm UTC](https://community.silverbullet.md/t/plotting-plug/3417/4 "2025-11-18T19:03:41Z")
Nice!
This can be adapted into a simple inline expression and a [YAML block](https://silverbullet.md/Objects#data) with configuration and datapoints.
```auto
#plot
type: bar
labels: ['eat', 'sleep', 'code']
name: hrs
data: [2,8,1]
```
```auto
#plot
type: scatter
name: func1
data:
- [0,0]
- [2,2]
- [3,9]
```
or simply:
```auto
#plot
data: [3,2,4]
```
`${plt.plot()}` for first local `#plot` data block or
`${plt.plot('objname', i)}` for i-th local `#objname` data block
space-lua:
```auto
plt = plt or {}
plt.queryLocalObjs = function (object, idx)
local pg = editor.getCurrentPage()
local ret = query[[from index.tag(object) where page == pg order by pos]]
if idx then
ret = ret[idx]
end
return ret
end
local chartjs = js.import("https://cdn.jsdelivr.net/npm/chart.js@4.5.1/auto/+esm")
plt.plot = function (obj, idx)
local obj = obj or 'plot'
local idx = idx or 1
local plotcfg = plt.queryLocalObjs(obj, idx)
local config = {
type = plotcfg.type or 'bar',
data = {
labels = plotcfg.labels or plotcfg.data,
datasets = {
{
label = plotcfg.name or {'trace1'},
showLine = 'true',
data = plotcfg.data
}
}
}
}
local canvas = dom.canvas {
id = "chart-" .. os.time() .. "-" .. math.random()
}
local rendered = false
local function timeout()
local target = js.window.document.getElementById(canvas.id)
if not target then
js.window.setTimeout(timeout, 100)
return
end
if rendered then
return
end
rendered = true
js.new(chartjs.Chart, target, config)
end
js.window.setTimeout(timeout, 100)
return widget.html(canvas)
end
```
---
### Author:  [@Krishna-Sivakumar](https://community.silverbullet.md/u/Krishna-Sivakumar)
#### Post date: [November 23, 2025, 1:28am UTC](https://community.silverbullet.md/t/plotting-plug/3417/5 "2025-11-23T01:28:02Z")
Is there any way right now to get Silverbullet to distribute JS libraries locally? @zef
It’ll be useful here, since this won’t be available offline.
---
### Author:  [@LelouchHe](https://community.silverbullet.md/u/LelouchHe)
#### Post date: [November 23, 2025, 5:05am UTC](https://community.silverbullet.md/t/plotting-plug/3417/6 "2025-11-23T05:05:41Z")
I think we can do that with the new [Libraries](https://silverbullet.md/Libraries) in the edge version. But it still requires online when you first install that library.
Let me try it later.
---
### Author:  [@LelouchHe](https://community.silverbullet.md/u/LelouchHe)
#### Post date: [November 23, 2025, 8:00am UTC](https://community.silverbullet.md/t/plotting-plug/3417/7 "2025-11-23T08:00:32Z")
I have created a plug to provide offline chart plot here: [GitHub - LelouchHe/silverbullet-chart](https://github.com/LelouchHe/silverbullet-chart)
You can install it from Library Manager with URI `ghr:LelouchHe/silverbullet-chart/PLUG.md`
For now, it bundles Chart.js (4.5.1) and chartjs-plugin-annotation (3.1.0)
Feel free to try and create a pull request to add new plugins.
---
### Author:  [@malys](https://community.silverbullet.md/u/malys)
#### Post date: [December 5, 2025, 8:15am UTC](https://community.silverbullet.md/t/plotting-plug/3417/8 "2025-12-05T08:15:22Z")
Fantastic. The next step is to publish It as SB library
---
### Author:  [@malys](https://community.silverbullet.md/u/malys)
#### Post date: [December 6, 2025, 9:44am UTC](https://community.silverbullet.md/t/plotting-plug/3417/9 "2025-12-06T09:44:49Z")
Work in progress.
---
### Author:  [@zeus-web](https://community.silverbullet.md/u/zeus-web)
#### Post date: [July 31, 2026, 6:41am UTC](https://community.silverbullet.md/t/plotting-plug/3417/10 "2026-07-31T06:41:01Z")
Hi,
I'm using Lelouch's Plug and it is working fine so far (Thanks for that, @LelouchHe !)
However, the graphs appear pretty small on my screen:
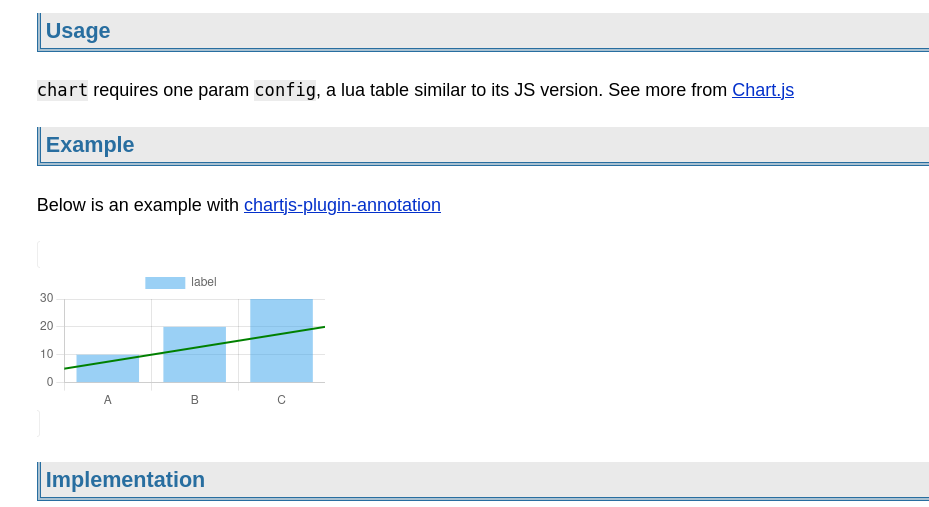
Is there any way to alter the displayed size?
Especially, if I have lots of datapoints it's getting hard to read... So it would be nice to have something like "width=70%" or similar.
I can not say, if there is some setting / styling within my Space, which affects that, but I could not find anything...
Thanks a lot for any hint!
Nico
---
### Author:  [@zeus-web](https://community.silverbullet.md/u/zeus-web)
#### Post date: [August 4, 2026, 9:45am UTC](https://community.silverbullet.md/t/plotting-plug/3417/11 "2026-08-04T09:45:16Z")
Additional information:
Looks like the size is browser specific. When I open the page in Chrome instead of Firefox, the graphs are using much more width, in fact, it is way too big there...
---
### Author:  [@zeus-web](https://community.silverbullet.md/u/zeus-web)
#### Post date: [August 4, 2026, 3:24pm UTC](https://community.silverbullet.md/t/plotting-plug/3417/12 "2026-08-04T15:24:57Z")
OK, after some tinkering, I found a workaround.
I added two lines to the canvas definition in the chart LUA-function:
```auto
local canvas = dom.canvas {
id = "chart-" .. os.time() .. "-" .. math.random(),
width = config.options.width or nil,
height = config.options.height or nil,
}
```
This way I could add some new options to the config-Object of the graph:
```auto
options = {
responsive = false,
width= 1000,
height = 300,
plugins = { ....
```
@LelouchHe: Maybe something like that could be added in your original version, too?
Another working approach seems to be adding a class for the canvas, like this:
```auto
local canvas = dom.canvas {
(...)
class = config.class or nil
(...)
}
```
and a style:
```auto
.chart {
width: 50%;
height: 100wv;
}
```
And adding that to the function call (one must add "responsive = false", too!):
```auto
${chart {
(...)
class = "chart",
(...)
options = {
responsive = false,
plugins = {
(...)
```